
Corn (Zea mays L.) yield productivity is driven by a multitude of factors, specifically genetics, environment, and management practices, along with their corresponding interactions. Despite continuous monitoring through proximal or remote sensors and advanced predictive models, understanding these complex interactions remains challenging. While predictive models are improving with regard to accurate predictions, they often fail to explain causal relationships, rendering them less interpretable than desired. Process-based or biophysical models such as the Agricultural Production Systems sIMulator (APSIM) incorporate these causalities, but the multitude of interactions are difficult to tease apart and are largely sensitive to external drivers, which often include stochastic variations. To address this limitation, we developed a novel methodology that reveals these hidden causal structures. We simulated corn production under varied conditions, including different planting dates, nitrogen fertilizer amounts, irrigation rules, soil and environmental conditions, and climate change scenarios. We then used the simulation results to rank features having the largest impact on corn yield through Random Forest modeling. The Random Forest model identified nitrogen uptake and annual transpiration as the most influential variables on corn yield, similar to the existing research. However, this analysis alone provided limited insight into how or why these features ranked highest and how the features interact with each other. Building on these results, we deployed a Causal Bayesian model, using a hybrid approach of score-based (hill climb) and constraint-based (injecting domain knowledge) models. The causal analysis provides a deeper understanding by revealing that genetics, environment, and management factors had causal impacts on nitrogen uptake and annual transpiration, which ultimately affected yield. Our methodology allows researchers and practitioners to unpack the “black box” of crop production systems, enabling more targeted and effective model development and management recommendations for optimizing corn production.
https://www.mdpi.com/2624-7402/7/11/366
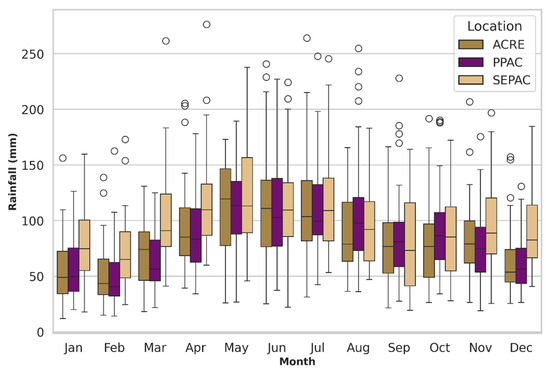
Monthly rainfall across the three locations over the past 38 years. Box plots show the distribution of monthly rainfall with the central line representing the median, box boundaries indicating the 25th and 75th percentiles (interquartile range), whiskers extending to 1.5 times the interquartile range, and circles representing outliers beyond the whisker limits.